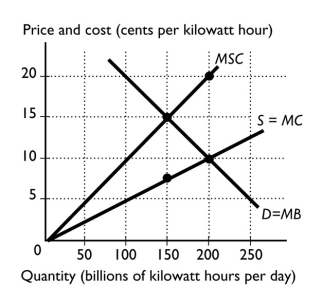
-The figure above shows the marginal social cost curve of generating electricity,the marginal private cost curve,and the demand curve.If the Coase theorem can be used in this market,output equals ________ kilowatt hours per day.
Definitions:
Fixed Costs
Costs that do not vary with output.
Variable Costs
Costs that change as output levels change.
Marginal Costs
The additional cost incurred in the production of one more unit of a good or service.
Fixed Costs
Costs that do not change with the amount of goods or services produced, such as rent, salaries, or insurance.
Q1: Which of the following statements about health-care
Q19: "For the U.S.personal income tax,the average tax
Q73: The tragedy of the commons is the
Q74: The figure above shows Sarah's budget line.Sarah
Q95: The figure above shows the market for
Q110: "Tariffs today in the United States are
Q119: Relative to free trade,domestic consumers of a
Q143: International trade benefits<br>A) only the exporter.<br>B) only
Q145: A good that can be consumed even
Q226: The benefits principle of fair taxation<br>A) can