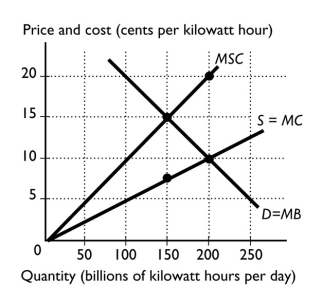
-The figure above shows the marginal social cost curve of generating electricity,the marginal private cost curve,and the demand curve.If the government imposes a pollution tax to achieve the efficient level of production,the tax equals ________ per kilowatt hour.
Definitions:
Universalization Test
A principle in ethics that evaluates the morality of actions based on their applicability to all individuals in similar situations.
Sarbanes-Oxley Act
A U.S. law enacted to protect investors by improving the accuracy and reliability of corporate disclosures.
Financial Reports
Detailed records of a company or organization's financial health, performance, and cash flows over a specific period.
Public Disclosure
The act of making information or data known to the public, especially in contexts requiring transparency and accountability.
Q21: If a pollution tax in a market
Q33: Compared to other major nations,the United States
Q40: How does the government determine the quota
Q62: Some policymakers have proposed giving parents of
Q63: A good is rival if<br>A) it has
Q113: The above figure shows the U.S.market for
Q124: Most t-shirts bought by Americans are made
Q174: Which of the following chain of events
Q189: Marginal social cost is equal to<br>A) the
Q211: Relative to free trade,domestic producers of a