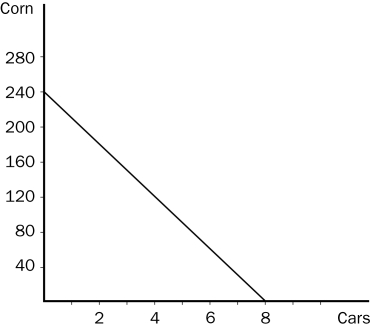
Figure 3-5 The graph below represents the various combinations of cars and corn that Country A could produce in a given month. (On the vertical axis, corn is measured in bushels.)

-Refer to Figure 3-5.Which of the following combinations of cars and corn could Country A produce in a given month?
Definitions:
High School
An educational institution that provides secondary education to adolescents, typically covering grades 9 through 12.
College
An institution of higher learning that offers undergraduate programs, often leading to a bachelor's degree in a specific field of study.
Labor Force
The total number of people who are employed and unemployed but seeking work in an economy.
Schooling In Capitalist America
Analysis of how the educational system in capitalist societies serves to reinforce class structure and maintain social inequalities.
Q14: Here are some production possibilities for an
Q25: To raise productivity,policymakers could<br>A)increase spending on education.<br>B)provide
Q60: Equity refers to how the pie is
Q78: The historical rise in living standards of
Q82: David Ricardo was the author of<br>A)An Inquiry
Q94: Refer to Table 3-3.The opportunity cost of
Q144: Which of the following statements about economic
Q149: Refer to Figure 3-4.Barney has an absolute
Q184: A surplus exists in a market if<br>A)there
Q244: In the markets for goods and services,as