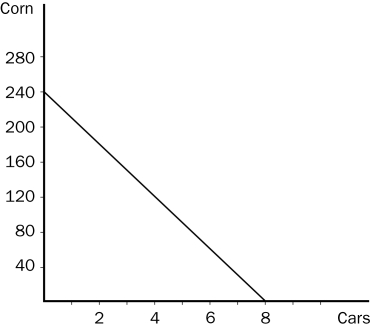
Figure 3-5 The graph below represents the various combinations of cars and corn that Country A could produce in a given month. (On the vertical axis, corn is measured in bushels.)

-Refer to Figure 3-5.Which of the following combinations of cars and corn could Country A not produce in a given month?
Definitions:
PERT Chart
A project management tool used to schedule, organize, and coordinate tasks within a project.
Delayed
Occurring later than expected or intended; postponed.
Planned Deadlines
Specified dates by which tasks or projects are targeted to be completed.
Additional Funds
Extra money made available for a particular purpose.
Q18: When there is a shortage of 100
Q70: Sometimes economists disagree because their scientific judgments
Q94: Refer to Figure 5-2.If the price decreased
Q105: If the price elasticity of demand for
Q124: Specialization and trade are closely linked to<br>A)absolute
Q146: The business cycle is the<br>A)relationship between unemployment
Q185: Suppose that a worker in Radioland can
Q201: The opportunity cost of an item is<br>A)the
Q218: Refer to Figure 4-3.The graph shows the
Q278: Suppose there is an increase in steel