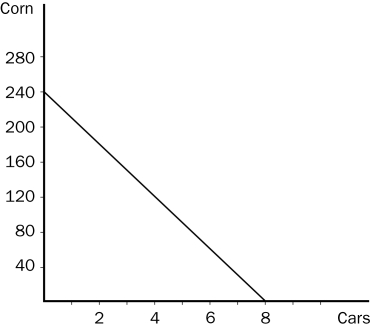
Figure 3-5 The graph below represents the various combinations of cars and corn that Country A could produce in a given month. (On the vertical axis, corn is measured in bushels.)

-Refer to Figure 3-5.Suppose Country A decides to increase its production of corn by three bushels.What is the opportunity cost of this decision?
Definitions:
Pure Discount Loan
A loan where the borrower receives a sum of money upfront and repays a higher amount at the end of the loan period, effectively paying interest by the difference.
Lump Sum Payment
An isolated financial disbursement occurring once, instead of being divided into multiple payments over a duration.
Annual Interest Payments
Periodic payments made to bondholders, typically annually, that represent the interest earned on the investment.
Effective Annual Rate
The real return on an investment, taking into account the effect of compounding interest over a year.
Q18: Refer to Table 3-2.For Carolyn,the opportunity cost
Q23: Refer to Figure 3-2.Originally,Ben was producing at
Q39: Refer to Table 4-4.Which space represents an
Q86: Which of the following is the most
Q86: Refer to Table 4-1.When the price of
Q122: A recently-developed theory asserts that Homo sapiens
Q130: The government can potentially improve market outcomes
Q181: An increase in the number of college
Q221: Suppose roses are currently selling for $40.00
Q222: The ordered pair that represents the origin