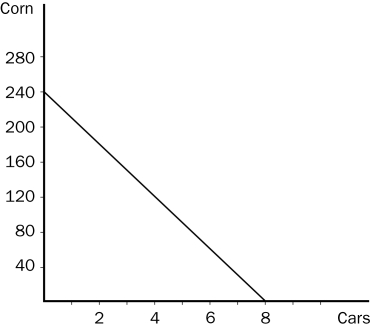
Figure 3-5 The graph below represents the various combinations of cars and corn that Country A could produce in a given month. (On the vertical axis, corn is measured in bushels.)

-Refer to Figure 3-5.Under which of the following circumstances would Country A be able to consume outside of its production possibilities frontier?
Definitions:
Direct Labor
The cost of wages paid to workers directly involved in the production of goods or services.
Job Order Cost Sheets
Documents that record and track the costs associated with a specific job or order.
Cost of Goods Sold
The direct costs attributable to the production of the goods sold by a company, including the cost of the materials and labor directly used in creating the good.
Work in Process Inventory
Items of inventory that are in the process of being produced but are not yet finished goods.
Q34: An economic model can accurately explain how
Q49: Elasticity of demand is closely related to
Q55: Which of the following events could shift
Q81: Refer to Figure 3-3.The opportunity cost of
Q91: A reduction in an input price will
Q112: Buyers and sellers who have no influence
Q146: Which of the following items is not
Q159: Which of the following is a determinant
Q215: When studying the effects of changes in
Q250: Which of the following statements is correct?<br>A)Buyers