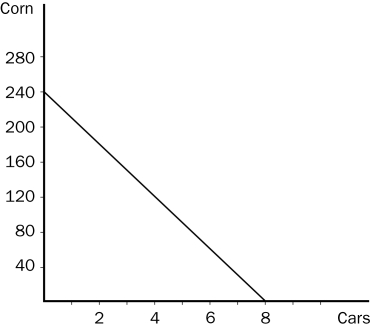
Figure 3-5 The graph below represents the various combinations of cars and corn that Country A could produce in a given month. (On the vertical axis, corn is measured in bushels.)

-Refer to Figure 3-5.The fact that the line slopes downward reflects the fact that
Definitions:
Leakages
In the context of economics, refers to any portion of income that is not used for domestic spending, such as savings, taxes, or imports.
Injections
In the context of an economy, Injections refer to the introduction of income into the circular flow of money, such as investments, government spending, and exports.
Circular Flow Model
An economic model illustrating the continuous flow of money, resources, and goods among households and businesses in an economy.
Value Added
The increase in worth of a product or service as a result of a particular process, typically measured as the difference between the market price and the production cost.
Q117: Refer to Figure 3-4.Initially,Barney is spending one-half
Q127: A demand curve shows the relationship<br>A)between income
Q153: An increase in the price of a
Q157: Refer to Table 3-4.Which of the following
Q161: Trade between countries<br>A)allows each country to consume
Q174: The use of theory and observation is
Q219: The use of the coordinate system allows<br>A)for
Q221: The point where both x and y
Q223: The line that relates the price of
Q242: The midpoint method is used to compute