Figure 5-8. A demand curve is shown on the graph below. On the graph, Q represents quantity demanded and P represents price.
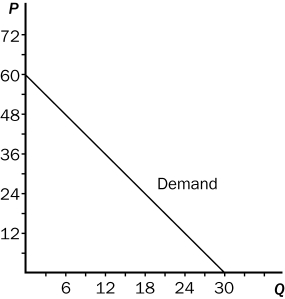
-Refer to Figure 5-8.Using the midpoint method,between prices of $48 and $54,price elasticity of demand is about
Definitions:
Market-Based
Pricing or decision-making strategies that are influenced primarily by market conditions and customer demand rather than internal cost considerations.
Marginal Cost
The cost of producing one additional unit of a product, which can include materials, labor, and other variable costs.
Negotiated Transfer
A transfer price that is agreed upon by the selling and buying divisions within the same company through negotiation.
Performance Measures
Metrics or indicators used to assess, track, and improve the efficiency and effectiveness of processes, employees, or organizations.
Q9: An increase in the price of pure
Q29: Use the graph shown to answer the
Q48: Refer to Figure 6-8.The equilibrium price in
Q50: Last year,Joan bought 50 pounds of hamburger
Q55: Refer to Table 7-1.If the table represents
Q105: A tax on the buyers of coffee
Q113: For a particular good,a 3 percent increase
Q189: Suppose that when the price of corn
Q271: For a good that is a necessity,<br>A)quantity
Q275: The flatter the demand curve that passes