Figure 6-11. On the graph below, the shift of the supply curve from S₁ to S₂ represents the imposition of a tax on a good. On the axes, Q represents the quantity of the good and P represents the price.
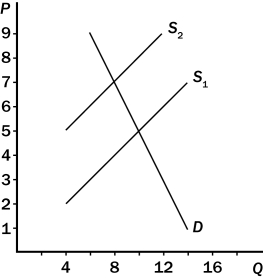
-Consider Figure 6-11.Suppose the demand curve is not the one drawn on the graph;instead,the demand curve is a vertical line passing through the point (Q = 10,P = 5) .Using the two supply curves that are drawn,which of the following statements would describe the effects of the tax correctly?
Definitions:
Working Memory
A term describing the status of thoughts in memory that are currently activated.
Final Words
The last statements or spoken thoughts expressed by a person before dying or concluding a significant event or statement.
Goal Maintenance
The mental process of keeping one’s goal in mind to guide the selection of the next actions.
Frontal Lobe
The part of the brain located at the front of the skull, responsible for executive functions such as decision making, problem-solving, and controlling behavior.
Q42: A price floor is not binding if<br>A)the
Q43: In a market,the price of any good
Q67: Refer to Table 7-3.If the market price
Q106: A price ceiling<br>A)is a legal maximum on
Q151: Which of the following equations is not
Q179: At any quantity,the price given by the
Q190: Which of the following statements is not
Q197: Which of the following events would increase
Q223: In the market for oil in the
Q226: Revenue from the Federal Insurance Contribution Act