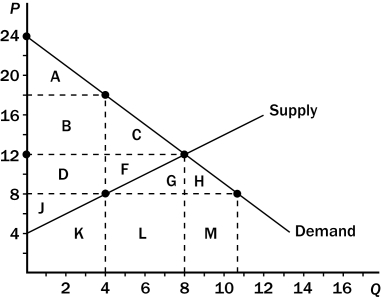
Figure 8-7 The graph below represents a $10 per unit tax on a good. On the graph, Q represents quantity and P represents price.

-Refer to Figure 8-7.The tax causes producer surplus to decrease by the area
Definitions:
Stockholders' Equity
The ownership stake of shareholders in a company, calculated as the value of the company's assets minus its debts.
Return On Total Assets
A profitability ratio that measures the net income generated for each dollar of assets a company owns.
Balance Sheet
A financial breakdown that illustrates a company's assets, debts, and the stake of shareholders at a fixed point in time.
Income Statement
A financial statement that reports a company's financial performance over a specific accounting period.
Q52: Suppose a tax of $1 per unit
Q58: Honey producers provide a positive externality to
Q68: Refer to Figure 9-13.The country for which
Q84: Using the graph shown,determine the value of
Q110: A consumer's willingness to pay directly measures<br>A)the
Q153: When a tax is imposed on the
Q157: For a good that is taxed,the area
Q159: Suppose that at present there are no
Q213: Refer to Figure 8-3.The price that buyers
Q249: If a sawmill creates too much noise