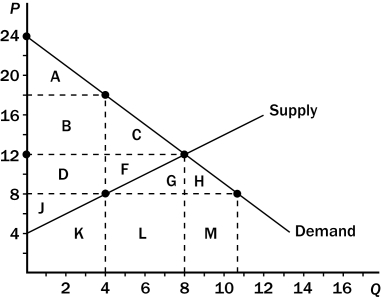
Figure 8-7 The graph below represents a $10 per unit tax on a good. On the graph, Q represents quantity and P represents price.

-Refer to Figure 8-7.The government collects tax revenue that is represented by the area
Definitions:
Secondary Effects
The indirect impacts of an economic event, policy, or decision that may occur as a consequence of the primary effect, affecting different sectors or parts of the economy.
Economics
The social science that studies how individuals, governments, and societies make choices regarding the allocation of limited resources to satisfy unlimited wants.
Nobel Prize
Prestigious international awards granted annually in several categories including Physics, Chemistry, Medicine, Literature, and Peace, recognizing significant contributions to humanity.
Social Science
The field of scholarly or scientific study that examines society and human behaviors in various contexts.
Q4: The demand for bread is less elastic
Q77: Refer to Figure 7-4.When the price rises
Q88: Refer to Figure 9-2.With trade,China will<br>A)import 100
Q119: The deadweight loss of a tax rises
Q133: Refer to Figure 7-10.At the market-clearing equilibrium,total
Q140: An externality exists whenever<br>A)the economy can benefit
Q178: A tax on a good causes the
Q193: Refer to Figure 8-4.After the tax is
Q195: When the demand for a good increases
Q229: When a country allows trade and becomes