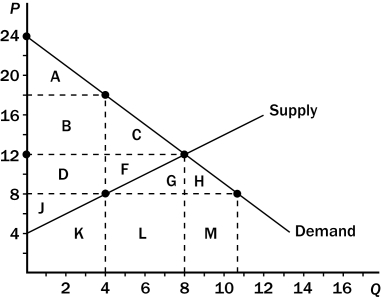
Figure 8-7 The graph below represents a $10 per unit tax on a good. On the graph, Q represents quantity and P represents price.

-Refer to Figure 8-7.The decrease in consumer and producer surpluses that is not offset by tax revenue is the area
Definitions:
Priming
A technique in psychology where exposure to one stimulus influences the response to a subsequent stimulus, without conscious guidance or intention.
TV Soap Opera
A serialized television drama focusing on domestic situations and often characterized by melodrama.
Marital Conflict
Disputes or disagreements between married partners, which can range from minor disputes to severe relational disturbances.
Context-Dependent Memory
The improved recall of specific episodes or information when the context present at encoding and retrieval is the same.
Q33: Suppose the demand for nachos increases.What will
Q35: Refer to Figure 9-11.Consumer surplus after trade
Q36: Since half of the FICA tax is
Q56: Refer to Table 7-5.As the table suggests,the
Q74: Deadweight loss is the<br>A)decline in total surplus
Q116: The distinction between efficiency and equity can
Q158: Refer to Figure 9-2.The increase in total
Q168: When negative externalities are present in a
Q241: Which U.S.president lost his bid for re-election,in
Q251: Market failure can be caused by<br>A)too much