Multiple Choice
Figure 13-7
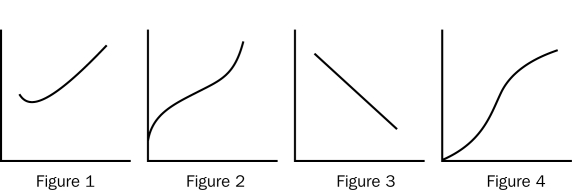
-Refer to Figure 13-7.Which of the figures represents the total cost curve for a firm?
Definitions:
Related Questions
Q24: When a profit-maximizing competitive firm finds itself
Q32: The largest source of income for the
Q35: Refer to Table 14-1.The price and quantity
Q61: In the long-run equilibrium of a market
Q97: In a competitive market,the actions of any
Q121: In the long run,when marginal cost is
Q137: Why do wild salmon populations face the
Q218: When a profit-maximizing firm in a competitive
Q247: Refer to Table 14-2.Consumers are willing to
Q296: When comparing short-run average total cost with