Use the two graphs in the diagram to answer the following questions.
Figure 35-3
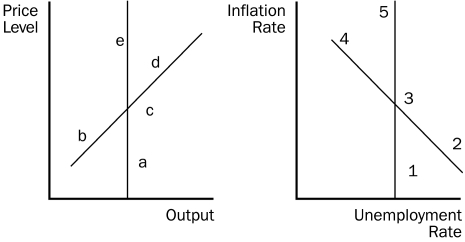
-Refer to Figure 35-3.Starting from c and 3,in the long run,a decrease in money supply growth moves the economy to
Definitions:
Consumer Surplus
The gap between the amount consumers are prepared to pay for a product or service and the actual price they pay.
Surplus Increase
Refers to the rise in excess resources or goods available beyond what is needed or consumed.
Sellers' Costs
The expenses incurred by sellers in providing goods or services, including production, labor, and marketing costs.
Price
The amount of money required to purchase a good or service, determined by factors such as supply and demand.
Q17: Marginal cost is _.<br>A)The cost of producing
Q31: You own a tract of trees and
Q115: Refer to Figure 35-1.If the economy starts
Q125: An increase in the MPC<br>A)increases the multiplier,
Q152: In 1980,the U.S.economy had an inflation rate
Q193: Most economists believe that classical theory explains
Q195: Suppose the Fed decreased the growth rate
Q208: Assume the multiplier is 5 and that
Q243: Assuming crowding-out but no multiplier or investment-accelerator
Q277: Which of the following is a lesson