Use the figure below to answer the following question(s) .
Figure 4-7
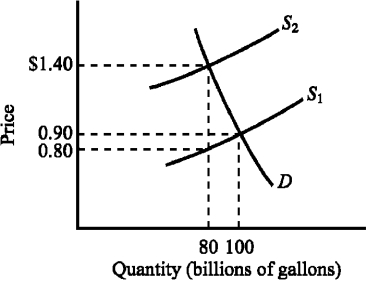
-Refer to Figure 4-7.The supply curve S₁ and the demand curve D indicate initial conditions in the market for gasoline.A $.60-per-gallon excise tax on gasoline is levied,which shifts the supply curve from S₁ to S₂.Imposing the tax causes the equilibrium price of gasoline to increase from
Definitions:
Fixed Assets
Long-term tangible assets held for business use and not expected to be converted to cash in the upcoming fiscal year.
Sales Capacity
The maximum volume or number of units a company can sell under current resources and market conditions.
Projected Future Sales
An estimate of the amount of sales or revenues that a company expects to achieve in a future period.
Debt-Equity Ratio
An index showing the relative financing contribution of equity and debt to a company's assets.
Q8: If the supply of a good is
Q45: If the construction of a new roadway
Q69: A tax for which the average tax
Q88: A new law requiring plumbers to pass
Q150: If Heather's tax liability increases from $10,000
Q216: If the government wants to raise tax
Q272: Refer to Figure 3-17.Area C represents<br>A)the decrease
Q291: If we observe an increase in the
Q298: If we observe a decrease in the
Q354: Which of the following would decrease the