Use the figure below to answer the following question(s) .
Figure 4-9 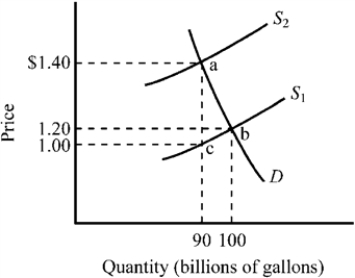
-Refer to Figure 4-9. The market for gasoline was initially in equilibrium at point b and a $.40 excise tax is illustrated. Which of the following states the actual burden of the tax?
Definitions:
Pearson Correlation Value
A statistic that measures the linear correlation between two variables, indicating the strength and direction of their relationship.
Variance
A measure of the dispersion or spread of a set of values, calculated as the average of the squared deviations from the mean.
Research Hypothesis
A statement made for a study based on predictions of a possible outcome, which can be tested through research or experimentation.
Correlation Coefficient
An index that quantifies the magnitude and direction of a straight-line association between a pair of variables.
Q16: The government sometimes provides public goods because<br>A)private
Q17: Which of the following best explains why
Q39: The term "deadweight loss" or "excess burden"
Q64: It is difficult for the market process
Q74: Refer to Figure 3-21.At the quantity Q₂,<br>A)the
Q108: Which of the following transactions would be
Q109: After a hurricane in Florida knocked out
Q125: If Neleh's income increases from $60,000 to
Q201: If Joan pays $5,000 in taxes when
Q301: Refer to Figure 4-24.The price that buyers