Use the figure below to answer the following question(s) .
Figure 6-1 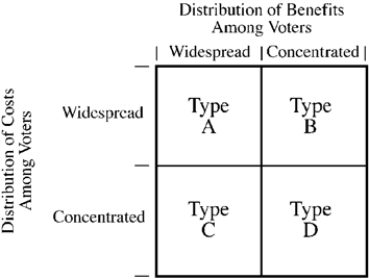
-Figure 6-1 illustrates the four possibilities of the distribution of costs and benefits among voters for a government project. Programs that give subsidies to a small group of producers at general taxpayer expense would be considered
Definitions:
Price Level
Refers to the average of current prices across the entire spectrum of goods and services produced in the economy.
Production
The process of combining various material inputs and immaterial inputs (plans, knowledge) to make something for consumption.
Real GDP
Gross Domestic Product adjusted for inflation, providing a more accurate measure of an economy's size and growth rate over time.
Real GDP
The measure of a country's economic output adjusted for price changes (inflation or deflation), reflecting the true value of goods and services produced.
Q10: When politicians support policies that benefit small
Q13: Babe Ruth's 1931 salary was $80,000.Government statistics
Q22: How does a voting structure that relies
Q74: Government decisions tend to be biased against
Q82: Public choice theory suggests that politicians will
Q108: Frictional unemployment is the result of<br>A)not enough
Q145: When people speak of the labor force
Q155: The civilian labor force includes those individuals
Q195: When government gives a subsidy to buyers
Q210: In recent years,people have benefited from greater