The figure below illustrates the cost and revenue structure for a monopoly firm.
Figure 11-17
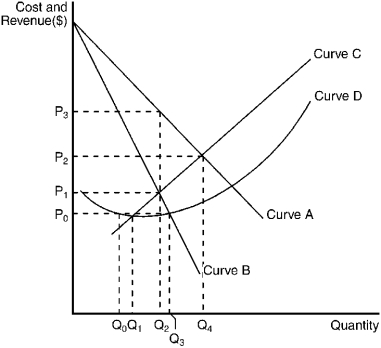
-Refer to Figure 11-17.If the monopoly firm is currently producing Q₃ units of output,then a decrease in output will necessarily cause profit to
Definitions:
Economic Duress
A condition in which one is forced to engage in a financial transaction due to threats or pressures, rendering the agreement involuntary.
Irrevocable Offer
An offer that cannot be withdrawn or canceled by the offeror for a specified period, assuming the offeree has given some consideration in exchange for the offer's irrevocability.
Merchant
An individual or entity engaging in the selling of goods or services professionally or commercially.
UCC
Uniform Commercial Code, a comprehensive set of laws governing all commercial transactions in the United States, intended to standardize and simplify the law.
Q31: If a profit-maximizing restaurant is going to
Q39: Which of the following has tended to
Q82: If the interest rate is 10 percent,the
Q107: If a market is contestable,the market will
Q112: Refer to Figure 10-13.The firm is currently
Q123: When an employer pays the cost of
Q126: In both price-taker and competitive price-searcher markets,the
Q148: Refer to Figure 11-17.The marginal revenue curve
Q160: If the monopolist is regulated by the
Q198: Profit-maximizing firms will expand their employment of