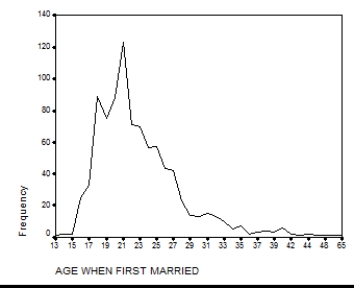
Presented below is a chart and a portion of the data for 550 respondents which were used to construct it.What is another type of graph that you can use to display this information? Construct this graph using the data below with the frequencies placed along the vertical axis.

Definitions:
Q3: Parameters are associated with _;whereas,statistics are associated
Q12: Imagine you wish to determine whether the
Q16: The Law School Admission Test (LSAT)is designed
Q17: The following data on social class and
Q28: The population mean is hypothesized to be
Q35: An oral report that includes a graphical
Q39: In a sample of 250 respondents,females account
Q42: Suppose that a researcher is interested in
Q43: To calculate sampling error for a proportion,which
Q53: Blame for response errors usually falls on