Essay
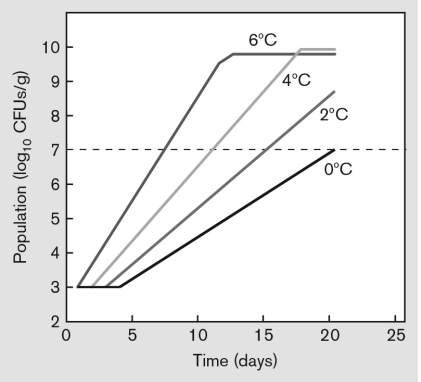
The graph below shows an experiment in which growth of aerobic bacteria in ground beef (CFUs/g) was measured at different refrigeration temperatures. Interpret the graph and explain what the dotted line represents.
Definitions:
Related Questions
Q10: Eolian sources of iron in marine systems
Q11: An ancient _ is assumed to be
Q18: With respect to quorum sensing, all of
Q22: Amanita phalloides makes a-amanitin, a dangerous toxin
Q36: Electron transport systems are embedded in all
Q41: Describe how modular enzymes function in polyketide
Q45: The role of the Hin recombinase is
Q56: What trait do all cells on Earth
Q58: The figure below is a transmission electron
Q72: What type of RNAs bind to complementary