Table 2-2
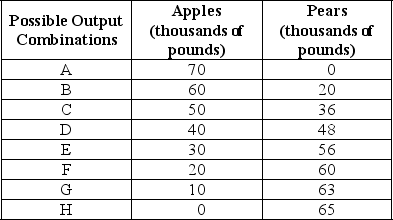
-Refer to Table 2-2.The Fruit Farm produces only apples and pears.The table above shows the maximum possible output combinations of the two fruits using all resources and currently available technology.
a.Graph The Fruit Farm's production possibilities frontier.Put apples on the horizontal axis and pears on the vertical axis.Be sure to identify the output combination points on your diagram.
b.Suppose The Fruit Farm is currently producing at point D.What is the opportunity cost of producing an additional 8,000 pounds of pears?
c.Suppose The Fruit Farm is currently producing at point D.What happens to the opportunity cost of producing more and more pears? Does it increase,decrease or remain constant? Explain your answer.
d.Suppose The Fruit Farm is currently producing at point G.What happens to the opportunity cost of producing more and more apples? Does it increase,decrease or remain constant? Explain your answer.
e.Suppose The Fruit Farm is plagued by the apple maggot infestation which destroys apple trees but not pears.Show in a graph what happens to its PPF.
Definitions:
Outward Shift
A movement of the supply or demand curve in an economic diagram indicating an increase in supply or demand, leading to changes in price and quantity.
Consumption Level
The total amount of goods and services that an individual or group consumes over a specific period.
Technological Improvement
Innovations and advancements in technology that enhance productivity, efficiency, and quality of goods and services.
Production Possibilities Frontier
A curve depicting all maximum output possibilities for two goods, given a set of inputs, representing the trade-offs in production choices.
Q4: Burning forests will<br>A)increase carbon levels in the
Q33: Nearly a quarter of China's 1.3 billion
Q35: Employees are officially responsible for paying 40
Q53: In 2011, floods damaged the Canadian wheat
Q55: In 2011, floods prevented many prairie farmers
Q69: Which of the following is a problem
Q74: Scarcity refers to a situation in which
Q94: The "tragedy of the commons" refers to
Q121: Refer to Scenario 1.1.Using marginal analysis terminology,
Q134: Refer to Figure 5.3.The private profit maximizing