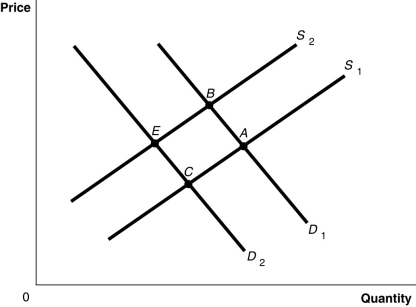
Figure 3-8

-Refer to Figure 3-8.The graph in this figure illustrates an initial competitive equilibrium in the market for apples at the intersection of D₁ and S₁ (point A) . If the price of oranges, a substitute for apples, decreases and the wages of apple workers increase, how will the equilibrium point change?
Definitions:
Economic Thinking
The analytical approach to address economic problems, considering costs and benefits in decision making.
Historical Generalizations
Broad statements derived from studying patterns and trends in history, often used to explain or predict social, political, or economic phenomena.
Statistical Data
Quantitative or qualitative information collected systematically for analysis, interpretation, and presentation for various purposes, including forecasting and decision making.
Abstract Theories
Concepts and models that are not tied to specific instances or physical examples, often used in academia to understand complex phenomena.
Q2: Refer to Figure 4.3.What is the value
Q20: Making "how much" decisions involve<br>A)calculating the total
Q21: The price elasticity of demand for Stork
Q36: The points outside the production possibilities frontier
Q51: An increase in the quantity of a
Q58: Refer to Figure 4.3.What is the value
Q74: Economists estimated that the price elasticity of
Q79: Which of the following statements is true?<br>A)Individuals
Q106: Refer to Table 2.4.What is South Korea's
Q128: Refer to Figure 6.7.What is the value