Figure 5.1
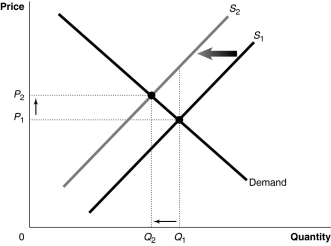
Figure 5-1 shows a market with an externality. The current market equilibrium output of Q₁ is not the economically efficient output. The economically efficient output is Q₂.
-Refer to Figure 5.1.If, because of an externality, the economically efficient output is Q₂ and not the current equilibrium output of Q₁, what does S₁ represent?
Definitions:
Vietnam War
A prolonged conflict from 1955 to 1975 between North Vietnam, supported by its communist allies, and South Vietnam, supported by the United States and other anti-communist countries.
Demand-Pull Inflation
Inflation that occurs when the demand for goods and services exceeds the available supply, leading to higher prices.
Official Unemployment Rate
The percentage of the labor force that is jobless and actively seeking employment, measured by government agencies to assess the economy's health.
Discouraged Workers
Individuals who are not actively looking for work because they believe no jobs are available for them or there are none for which they would qualify.
Q25: In economics, the optimal level of pollution
Q39: Refer to Table 2.1.Assume Tomaso's Trattoria only
Q50: Goods and services bought domestically but produced
Q63: Refer to Figure 5.4.Which of the following
Q67: Suppose the supply curve for digital cameras
Q93: Prince Edward Island is a province with
Q106: The income effect of a price change
Q110: Refer to Figure 5.6.One way to obtain
Q125: Refer to Figure 3.5.At a price of
Q140: Which of the following statements is true?<br>A)An