Figure 16-3 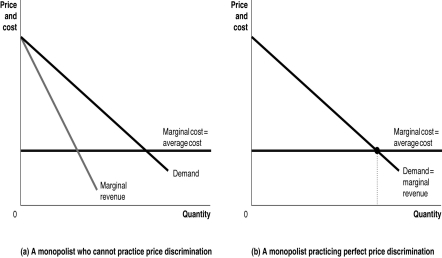
-Refer to Figure 16-3.Graph (a)represents a monopolist who cannot price discriminate and graph (b)represents a monopolist practicing perfect price discrimination.On each graph,identify the monopoly price,the monopoly output,the efficient output,and the areas representing profit,consumer surplus,and deadweight loss.
Definitions:
Long-Run Average Total Cost Curve
A graphical representation that shows the lowest possible cost at which a firm can produce any given level of output when all inputs are variable.
Technology
The application of scientific knowledge for practical purposes, especially in industry.
Gasoline Prices
The cost per unit volume of gasoline, typically influenced by factors like crude oil prices, taxes, and demand.
MC, AVC, ATC Curves
Graphs representing marginal cost, average variable cost, and average total cost, respectively, as functions of quantity produced.
Q4: Plasmodesmata permit cell-to-cell communication in plants.Similar structures
Q25: Refer to Table 16.2.What is the total
Q37: The central vacuoles of some plant cells
Q47: Evolution allows us to explain:<br>A)only the origin
Q53: Refer to Figure 13.5.At the profit-maximizing quantity,
Q60: Book publishers often use price discrimination across
Q77: "Sin taxes," such as taxes on alcoholic
Q91: WestJet Airlines wants to raise $20 million
Q118: When you buy newly-issued shares of Google
Q118: The government of Notrealia raises revenue through