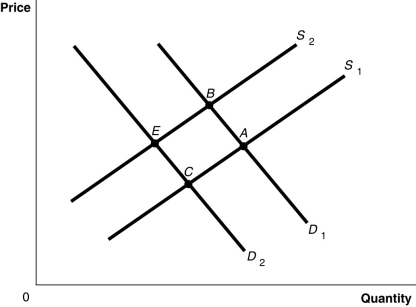
Figure 3-8

-Refer to Figure 3-8.The graph in this figure illustrates an initial competitive equilibrium in the market for apples at the intersection of D₁ and S₁ (point A) . If the price of oranges, a substitute for apples, decreases and the wages of apple workers increase, how will the equilibrium point change?
Definitions:
Q57: Refer to Figure 4-7.The figure above represents
Q104: Refer to Figure 4-18.What is the deadweight
Q203: Which of the following statements is true?<br>A)An
Q220: Even when the demand for one good
Q244: Technological advancements have led to lower prices
Q249: A firm has an incentive to decrease
Q290: If tablet computers are considered substitutes for
Q382: Refer to Table 3-4.The table above shows
Q396: When the marginal benefit equals the marginal
Q440: Refer to Figure 3-2.A decrease in the