Multiple Choice
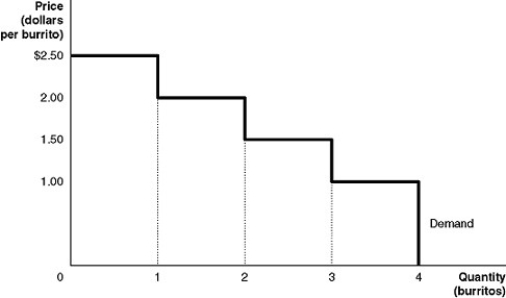
Figure 4-1

Figure 4-1 shows Arnold's demand curve for burritos.
-Refer to Figure 4-1.If the market price is $1.00, what is the consumer surplus on the third burrito?
Definitions:
Related Questions
Q13: Prices of smartphones (assume that this is
Q29: An advantage of imposing a tax on
Q47: Suppose that when the price of pickles
Q82: Over time,people in the United States and
Q118: The growing popularity of energy conservation has
Q148: Some environmentalists have criticized tradable emissions allowances
Q179: Refer to Figure 4-17.The deadweight loss due
Q252: In a competitive market the demand curve
Q318: Refer to Figure 4-3.If the market price
Q322: During the 1990s positive technological change in