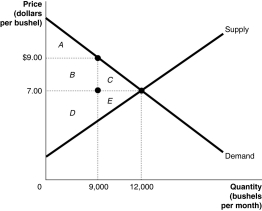
The graph below represents the market for alfalfa.The equilibrium price is $7.00 per bushel,but the market price is $9.00 per bushel.Identify the areas representing consumer surplus,producer surplus,and deadweight loss at the equilibrium price of $7.00 and at the market price of $9.00.
Definitions:
Loan Agreements
Contracts between a borrower and a lender outlining the terms of a loan.
Covenants
Agreements or clauses within a financial contract that obligate the borrower to meet specified conditions or restrict certain actions to protect the lender's interests.
Accounting Numbers
Financial figures derived from accounting practices that represent a company's financial performance and position.
Public Service Commission
A regulatory body governing the rates and services of public utilities, such as electricity, gas, and water within a certain jurisdiction.
Q10: Adverse selection is a situation in which
Q59: In a market with positive externalities,the market
Q130: Refer to Figure 4-25.The actual price of
Q141: Refer to Table 4-7.Suppose that the quantity
Q192: Refer to Figure 4-3.If the market price
Q236: Draw a supply and demand graph showing
Q246: Which of the following is an example
Q253: Use the following supply schedule for
Q323: Refer to Table 4-3.The table above lists
Q326: Refer to Figure 3-7.Assume that the graphs