Multiple Choice
Figure 9-4
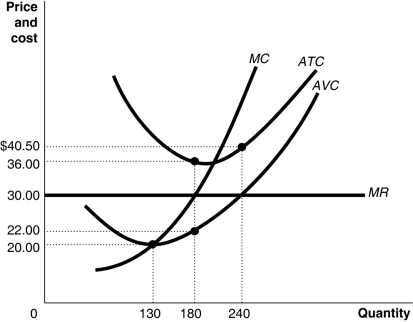 Figure 9-4 shows the cost and demand curves for a profit-maximizing firm in a perfectly competitive market.
-Refer to Figure 9-4.What is the amount of its total fixed cost?
Definitions:
Related Questions
Q14: Refer to Figure 10-9.What is the difference
Q32: Refer to Figure 10-15.The firm would maximize
Q122: In an increasing-cost industry the long-run supply
Q134: Explain how the listed events (a-d)would affect
Q135: Refer to Figure 8-11.If the firm chooses
Q154: Which of the following describes a situation
Q167: Average total cost is<br>A)total cost divided by
Q215: Refer to Figure 10-4.What is the amount
Q249: If,for a given output level,a perfectly competitive
Q269: Identify the type of merger in each