Figure 15-4
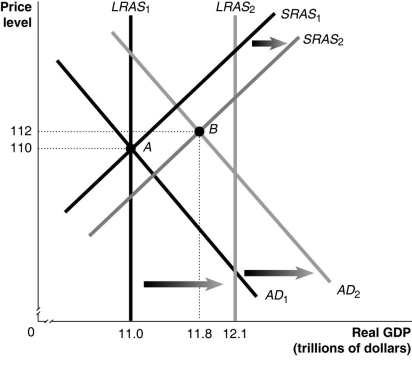
-Refer to Figure 15-4.In the figure above,LRAS₁ and SRAS₁ denote LRAS and SRAS in year 1,while LRAS₂ and SRAS₂ denote LRAS and SRAS in year 2.Given the economy is at point A in year 1,what is the growth rate in potential GDP in year 2?
Definitions:
Q19: Suppose that you decide that you no
Q28: Money's most narrow definition is based on
Q99: Refer to Figure 15-1.Ceteris paribus,an increase in
Q144: If,as economist Alwyn Young has suggested,high growth
Q161: Which of the following functions of money
Q189: Inflation rates during the years 1979-1981 were
Q210: A bank's largest liability is its<br>A)short-term borrowing.<br>B)long-term
Q216: A bank holds its reserves as _
Q258: Refer to Figure 17-8.In the figure above,if
Q278: The deflation of the 1930s impacted the