Figure 18-4
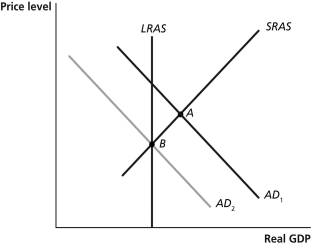
-Refer to Figure 18-4.In the graph above,suppose the economy is initially at point A.The movement of the economy to point B as shown in the graph illustrates the effect of which of the following policy actions by the Congress and the president?
Definitions:
Aggregate Quantity
The total amount or volume of a particular good or service produced or consumed in a given period.
Aggregate Demand Curve
A graphical representation showing the relationship between the overall price level in the economy and the total demand for goods and services at that price level.
Real Output
The total value of all goods and services produced by an economy, adjusted for inflation, representing the actual productivity.
Price Levels
A calculated average price for every good and service produced domestically.
Q19: An increase in interest rates<br>A)decreases investment spending
Q84: By the height of the housing bubble
Q93: When banks gain _,they can _ their
Q116: In the long run,most economists agree that
Q156: Refer to Table 19-11.If the actual terms
Q162: Suppose a transaction changes the balance
Q235: Consider the following T-account for a
Q261: When calculating GDP,the Bureau of Economic Analysis
Q286: Refer to Table 19-11.With trade,what is the
Q421: Refer to Table 19-12.If the actual terms