Multiple Choice
Use the figure for the question(s) below.
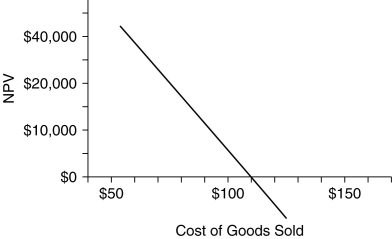
-The graph above shows the break-even analysis for the cost of making a certain good.Based on this chart,which of the following is true?
Definitions:
Related Questions
Q11: What is the yield to maturity of
Q12: Leverage is the amount of _ on
Q25: The CCA tax shield for Shepard Industries
Q29: A janitorial services firm is considering two
Q71: WestJet Airlines is considering purchasing 20 new
Q88: The volatility of Home Depot Share prices
Q95: Individual investors who grow up and live
Q99: Given an inflation rate of 3.24%,and a
Q108: Suppose a stock is currently trading for
Q114: Spacefood Products will pay a dividend of