Multiple Choice
Figure 3.8
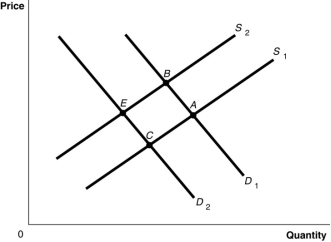
-Refer to Figure 3.8. The graph in this figure illustrates an initial competitive equilibrium in the market for apples at the intersection of D₁ and S₁ (point A) . If there is a shortage of apples how will the equilibrium point change?
Definitions:
Related Questions
Q16: Which of the following is part of
Q17: In an 'underground economy', the production of
Q24: Describe the pattern of growth in GDP
Q28: Refer to Figure 2.5. If the economy
Q45: What is a 'centrally planned economy'?<br>_<br>_
Q57: What makes up the natural rate of
Q64: An overcapacity of LCD fabrication plants causes
Q70: Economist Steve Landsburg has pointed out that
Q88: Which of the following is included in
Q99: Refer to Figure 3.2. A decrease in