Figure 3.8
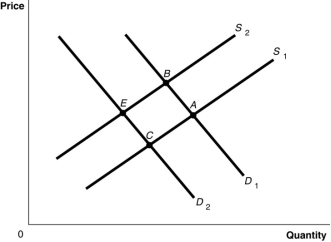
-Refer to Figure 3.8. The graph in this figure illustrates an initial competitive equilibrium in the market for sugar at the intersection of D₁ and S₁ (point A) . If there is an increase in the price of fertiliser used on sugar cane and there is a decrease in tastes for sugar-sweetened soft drinks, how will the equilibrium point change?
Definitions:
Processing Float
The time difference between when a transaction is initiated and when the funds are available in the account, affecting the usable balance.
Commercial Paper
Commercial paper refers to short-term, unsecured promissory notes issued by companies to finance their short-term liabilities.
Marketable Securities
Financial instruments that can be easily converted into cash, typically with high liquidity and short maturity periods.
Management of Cash
The strategies and practices employed by a firm to handle its cash flows, ensuring liquidity and operational efficiency.
Q2: Unemployment in Australia is:<br>A)significantly higher among older
Q9: The supply curve for watches:<br>A)shows the supply
Q9: Which of the following is not an
Q17: In an 'underground economy', the production of
Q36: What do economists call the extra cost
Q62: The 'rule of 70' states that:<br>A)it takes
Q70: Economist Steve Landsburg has pointed out that
Q95: Which of the following is most likely
Q107: Which country listed below experienced an increase
Q131: The three fundamental questions that any economy