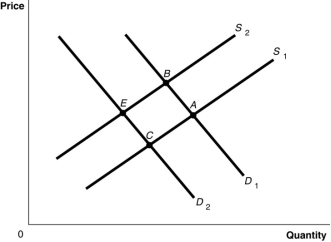
Figure 3.8

-Refer to Figure 3.8. The graph in this figure illustrates an initial competitive equilibrium in the market for sugar at the intersection of D₁ and S₂ (point B) . If there is a decrease in the price of fertiliser used on sugar cane and there is a decrease in tastes for sugar-sweetened soft drinks, how will the equilibrium point change?
Definitions:
Isolated Letters
Individual alphabetic characters presented separately from words or sentences, often used in reading or perception studies.
Stroop Effect
A phenomenon in cognitive psychology where there is a delay in the reaction time of a task when the color of words on a test and their meaning differ.
Ink Color
Ink color refers to the pigment or dye-based constitution that determines the visual perception of ink used in writing, printing, drawing, or any form of marking.
Cognitive Psychologist
a professional specializing in the study of mental processes such as "attention, language use, memory, perception, problem-solving, creativity, and thinking."
Q5: Consider the following economic agents:<br>A.the government<br>B.consumers<br>C.producers<br>Who, in
Q15: If an increase in crime causes people
Q35: A financial intermediary's main function is to
Q51: The labour force participation rates of men
Q90: Gross national income (GNI)is defined as the
Q100: How are the fundamental economic questions answered
Q105: When an economy is at its natural
Q110: Which of the following policies is designed
Q114: Which of the following would cause the
Q188: The primary purpose of _ is to