Multiple Choice
Refer to Figure 10.2 for the following questions.
Figure 10.2
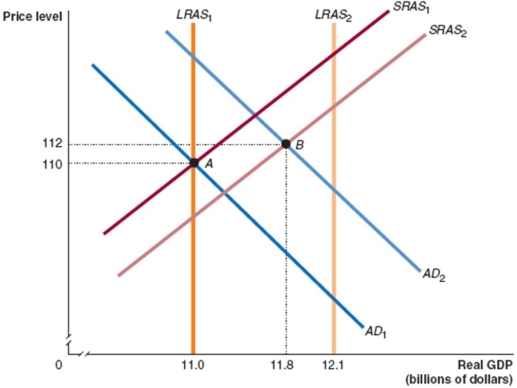
-In Figure 10.2, given the economy is at point A in year 1 and point B in year 2, what is the growth rate in potential GDP between those two years?
Definitions:
Related Questions
Q2: If consumers purchase fewer of those products
Q2: Unemployment in Australia is:<br>A)significantly higher among older
Q39: If nominal wages rise slower than the
Q49: Which is the largest component of aggregate
Q56: A rise in the rate of interest
Q70: An increase in real wages shifts the
Q109: Any _ by Australian residents from overseas
Q117: Is government debt bad for the economy?<br>_<br>_
Q122: Since the 1970s in Australia, net primary
Q127: What is the result if the economy