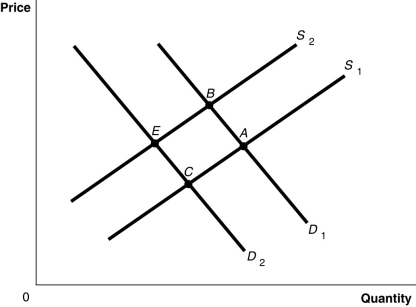
Figure 3-8

-Refer to Figure 3-8.The graph in this figure illustrates an initial competitive equilibrium in the market for apples at the intersection of D₁ and S₂ (point B) . Which of the following changes would cause the equilibrium to change to point C?
Definitions:
Q90: If the price of refillable butane lighters
Q103: Comparative advantage means the ability to produce
Q123: Refer to Figure 5-6.What is the deadweight
Q139: In recent years, the consumption of orange
Q153: Refer to Figure 4-10.Suppose the market is
Q180: Refer to Table 4-7.The equations above describe
Q193: If the quantity of sunglasses supplied is
Q198: Refer to Figure 4-4.The figure above represents
Q220: The income effect explains why there is
Q241: In 2004, hurricanes damaged a large portion