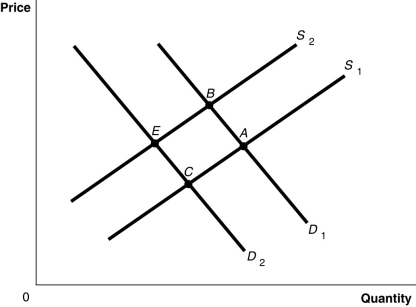
Figure 3-8

-Refer to Figure 3-8.The graph in this figure illustrates an initial competitive equilibrium in the market for apples at the intersection of D₁ and S₁ (point A) . If there is an increase in the wages of apple workers and an increase in the price of oranges, a substitute for apples, the equilibrium could move to which point?
Definitions:
Investment Horizon
Investment horizon refers to the total length of time an investor expects to hold an investment or portfolio before liquidating it.
Promised Yield
The return a bond issuer commits to pay to bondholders, usually expressed as an annual percentage.
Modified Duration
A measure of the sensitivity of a bond's price to changes in interest rates, indicating the percentage change in price for a one percent change in yield.
Yield To Maturity
The total return anticipated on a bond if it is held until its maturity date.
Q13: Refer to Table 2-6.What is Haley's opportunity
Q44: In June, buyers of titanium expect that
Q73: Refer to Figure 5-13.If the government wanted
Q86: As women's wages have risen relative to
Q114: Draw a supply and demand graph showing
Q129: An inward shift of a nation's production
Q166: A.C.Pigou argued that the government can deal
Q188: You are given the following market data
Q195: Refer to Table 4-3.The table above lists
Q201: If the production possibilities frontier is _,