Figure 4-4
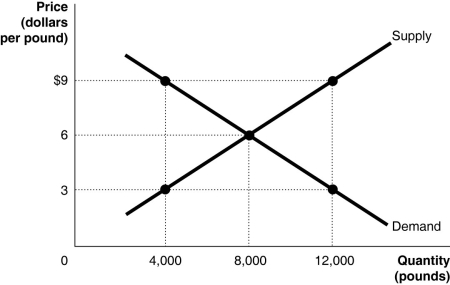
-Refer to Figure 4-4.The figure above represents the market for pecans.Assume that this is a competitive market.If the price of pecans is $9,
Definitions:
Supply Curves
Graphical representations showing the relationship between the price of a good and the quantity of the good that producers are willing to supply.
Willingness To Pay
The maximum amount an individual is prepared to spend to obtain a good or service or to avoid something undesirable.
Consumer Surplus
Consumer surplus is the difference between the maximum price consumers are willing to pay for a product or service and the actual price they pay.
Producer Surplus
Producer Surplus is the difference between what producers are willing to accept for a good or service versus what they actually receive, often depicted as the area above the supply curve and below the market price.
Q1: If the demand for a life-saving drug
Q40: Rayburn Reed is a highly talented photographer.He
Q84: Refer to Table 2-11.Scotland has a comparative
Q113: Refer to Table 2-8.If the two countries
Q114: Explain how the decision by parents to
Q149: Which of the following products comes closest
Q154: _ is maximized in a competitive market
Q184: Refer to Table 4-3.The table above lists
Q192: Necessities tend to have more inelastic demand
Q209: Orange juice drinkers want to consume more