Figure 4-12
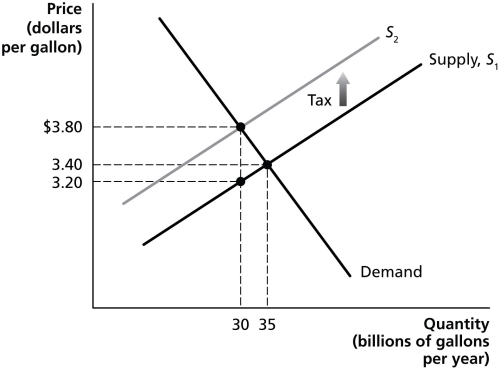
-Refer to Figure 4-12.The figure above represents demand and supply in the market for gasoline.Use the diagram to answer the following questions.
a.How much is the government tax on each gallon of gasoline?
b.What portion of the per-unit tax is paid by consumers?
c.What portion of the per-unit tax is paid by producers?
d.What is the quantity sold after the imposition of the tax?
e.What is the after-tax revenue per gallon received by producers?
f.What is the total tax revenue collected by the government?
g.What is the value of the excess burden of the tax?
Definitions:
Q33: Economists are reluctant to state that price
Q39: Which of the following displays rivalry and
Q58: Refer to Figure 3-8.The graph in this
Q59: A product is considered to be excludable
Q84: Nearly one-fifth of China's 1.38 billion people
Q126: Which of the following would result in
Q155: Refer to Figure 3-4.At a price of
Q171: Market equilibrium occurs where supply equals demand.
Q184: Assume there is a shortage in the
Q224: Studies have shown links between calcium consumption