Table 6-1
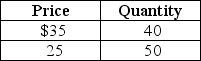
-Refer to Table 6-1.Suppose you own a bookstore.You believe that you can sell 40 copies per day of the latest John Grisham novel when the price is $35.You consider lowering the price to $25 and believe this will increase the quantity sold to 50 books per day.Compute the price elasticity of demand using the midpoint formula and these data.Select the correct implication from your work.
Definitions:
F-test Statistic
A calculated value used in the F-test to determine whether to reject the null hypothesis comparing the variances of two populations.
Error Terms
Variables in statistical models that account for the difference between observed and predicted values, representing unexplained or random variability.
Normal Probability Plot
A graphical tool used to determine if a dataset approximates a normal distribution, plotting observed values against theoretically expected values.
Sum of Squares for Error SSE
A measure used in statistical analysis to quantify the discrepancy between the observed and expected values, indicating the error in a regression model.
Q12: The price elasticity of demand for Kellogg's
Q32: A major problem with using a tradable
Q49: If the price of hairspray is represented
Q60: Goods can be classified on the basis
Q77: All of the following are examples of
Q101: The following equations represent the demand and
Q132: Which of the following describes how a
Q134: A negative externality exists if<br>A)there are price
Q159: "When it comes to public goods, individuals
Q170: Suppose that in a market for used