Figure 11-14
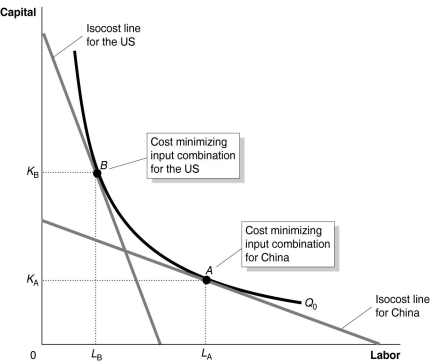
Figure 11-14 shows the optimal input combinations for the production of a given quantity of cotton in the United States and in China.
-Refer to Figure 11-14.Which of the following could explain why the United States and China use different input combinations to produce a given quantity of cotton and yet, each country produces that quantity at the lowest possible cost?
Definitions:
Q45: Refer to Table 11-7.What is the marginal
Q85: Which of the following is a characteristic
Q140: Central Grocery in New Orleans is famous
Q149: If production displays diseconomies of scale, the
Q158: Which of the following is a common
Q178: If a perfectly competitive firm's price is
Q203: Refer to Figure 12-6.Jason is currently producing
Q229: Consumers in a monopolistically competitive market do
Q242: Unlike a perfectly competitive firm, a monopolistic
Q281: A curve that shows combinations of consumption