Figure 13-4
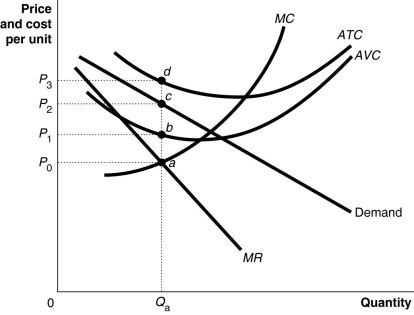
Figure 13-4 shows short-run cost and demand curves for a monopolistically competitive firm in the market for designer watches.
-Refer to Figure 13-4.What is the area that represents the total variable cost of production?
Definitions:
Markup
Markup refers to the difference between the selling price of a good or service and its cost, expressed as a percentage over the cost. It is used to cover expenses and generate profit.
Accumulated Depreciation
The total amount of a tangible fixed asset's cost that has been allocated as depreciation expense since the asset was put into use.
Differential Profit
The difference in profit between two business choices, helping in decision-making by highlighting the financial impact of each option.
Lease-End
The conclusion of a lease agreement, at which point the lessee may have options such as renewing the lease, returning the asset, or purchasing it.
Q20: Two firms would sometimes be better off
Q95: If firms are protected by substantial barriers
Q96: Perfectly competitive firms produce up to the
Q119: An agreement among firms to charge the
Q134: Refer to Figure 12-9.At price P₃, the
Q134: Which of the following will not happen
Q168: What is an isoquant? What is the
Q178: Refer to Figure 13-18.The diagram demonstrates that<br>A)in
Q216: Is a monopolistically competitive firm allocatively efficient?<br>A)No,
Q266: One reason why the "fast-casual" restaurant market