Figure 13-17
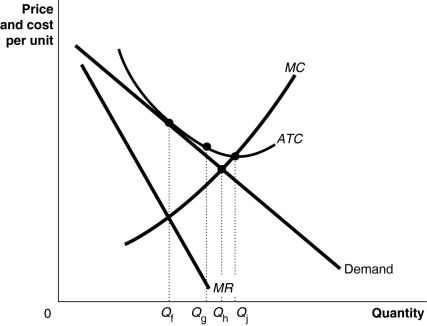
-Refer to Figure 13-17.In the long run, why will the firm produce Qf units and not Qg units, which has a lower average cost of production?
Definitions:
Production Technology
The methods, processes, and equipment used in the production of goods and services.
Market Quantity Supplied
The total amount of a specific good or service that is available for purchase in a market at a given price.
Market Supply Curve
A graphical representation showing the relationship between the price of a good and the total quantity of the good supplied by all suppliers at each price level.
Market Demand Curve
A graph showing the relationship between the price of a good or service and the quantity of that good or service that consumers are willing and able to purchase at various prices.
Q6: Refer to Figure 12-4.If the market price
Q12: Refer to Figure 12-9.Identify the short-run shutdown
Q12: Refer to Figure 14-4.How will Rainbow Writer
Q75: A perfectly competitive firm's supply curve is
Q109: Refer to Figure 14-2.If the government delays
Q134: Refer to Figure 15-6.The monopolist's total revenue
Q134: Refer to Figure 12-9.At price P₃, the
Q147: A virtuous cycle refers to the development
Q217: When large firms in oligopolies cut their
Q226: Which of the following is not a