Figure 13-10
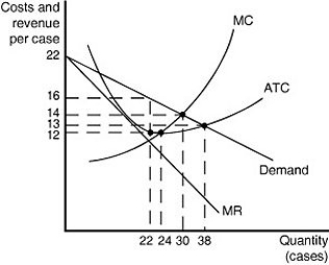
Figure 13-10 shows cost and demand curves for a monopolistically competitive producer of iced tea.
-Refer to Figure 13-10.to answer the following questions.
a.What is the profit-maximizing output level?
b.What is the profit-maximizing price?
c.At the profit-maximizing output level, how much profit will be realized?
d.Does this graph most likely represent the long run or the short run? Why?
Definitions:
Q4: Both buyers and sellers are price takers
Q74: What is the trade-off that consumers face
Q108: Which of the following statements is true?<br>A)The
Q123: What do Spotify and Apple have in
Q157: Refer to Table 13-3.What is its average
Q176: Refer to Figure 13-4.What is the area
Q189: Refer to Figure 12-1.If the firm is
Q218: In both monopolistically competitive and perfectly competitive
Q225: Refer to Figure 12-5.If the market price
Q254: If, as a perfectly competitive industry expands,