Multiple Choice
Figure 15-2
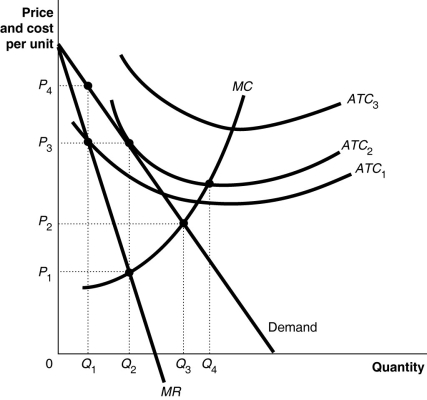
Figure 15-2 above shows the demand and cost curves facing a monopolist.
-Refer to Figure 15-2.If the firm's average total cost curve is ATC₁, the firm will
Definitions:
Related Questions
Q58: Which of the following is most likely
Q59: Suppose a competitive firm is paying a
Q76: In game theory, the three key characteristics
Q78: A firm using a two-part tariff can
Q122: Bubba's Hula Shack Bar and Bistro has
Q130: Refer to Figure 15-3.Suppose the monopolist represented
Q146: Most pharmaceutical firms selling prescription drugs continue
Q190: Which of the following pricing strategies allows
Q223: When the government makes a firm the
Q236: In economics, the study of the decisions