Multiple Choice
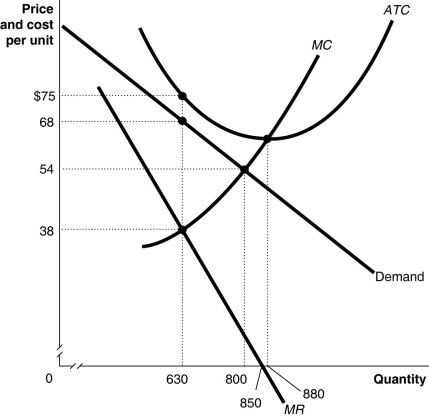
Figure 15-3

Figure 15-3 above shows the demand and cost curves facing a monopolist.
-Refer to Figure 15-3.What happens to the monopolist represented in the diagram in the long run, if costs and demand stay the same?
Definitions:
Related Questions
Q43: The bargaining power of suppliers increases if<br>A)the
Q96: The prisoner's dilemma illustrates<br>A)how oligopolists engage in
Q126: One requirement for a firm pursuing a
Q153: The Aluminum Company of America (Alcoa)had a
Q173: A monopoly firm is the only seller
Q184: Refer to Figure 13-13.What is the output
Q197: A set of actions that a firm
Q228: Which of the following is not an
Q246: A product's price approaches its marginal cost
Q277: A monopoly firm's demand curve<br>A)is the same