Figure 18-6
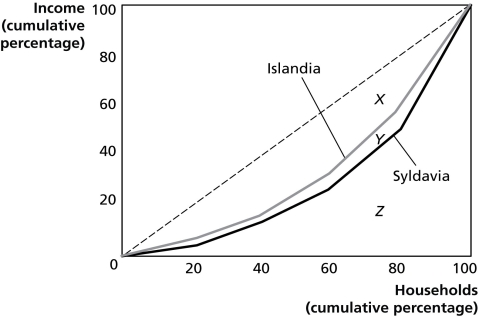
Figure 18-6 shows the Lorenz curves for Islandia and Syldavia.
-Refer to Figure 18-6.Which country has the more unequal distribution of income?
Definitions:
Substitute Goods
Products or services that can be used in place of each other, where an increase in the price of one leads to an increase in demand for the other.
Income
The financial gain earned or received over a period of time, typically through employment, investments, or business operations.
Flow Measure
A term used in economics to describe a quantity measured over a specified period of time, such as income per month or spending per year.
Quantity Demanded
The total number of units of a product or service that purchasers are eager and capable of procuring at a designated price level.
Q11: The fifteenth century saw a marked decline
Q12: Refer to Figure 18-9 to answer the
Q25: Who was the Italian merchant whose tales
Q46: Which major European disease caused high rates
Q71: Which of the following statements refers to
Q86: Refer to Table 17-4.What are the price
Q95: Employees _ income tax on their wages
Q109: During the past 30 years, income inequality
Q143: The marginal tax rate is<br>A)the amount of
Q267: All of the following will shift the