Figure 31.5
Use the graphs in Figures 31.4 and 31.5 and the following information when answering the corresponding questions.
Canadian and Swiss researchers (van der Heijden et al. ,1998) ,interested in factors affecting biodiversity,grew a variety of grassland plants in combination with one of four arbuscular mycorrhizal (AMF) species,no AMF,or all four AMF species together;and they measured plant growth under each set of conditions.All plant species were grown in each plot,so they always competed with each other with the only difference being which AMF were present.Use the graphs in Figure 31.5 to answer the questions that follow.Note that the x-axis labels indicate the number and identity of AMF species (bar 0 = no fungi;bars A-D = individual AMF species;bar A+B+C+D = all AMF species together) .The y-axis indicates the amount (grams) of plant biomass for the species shown in italics above each graph.Graph (e) is the total biomass (grams) of all 11 plant species combined;graph (f) is the biomass of Bromus erectus plants only,separated from the total.
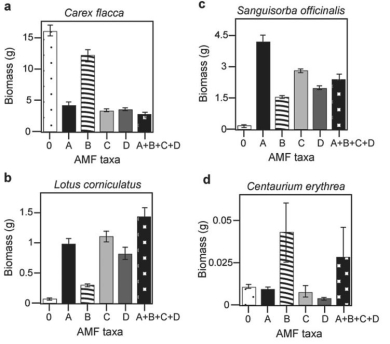
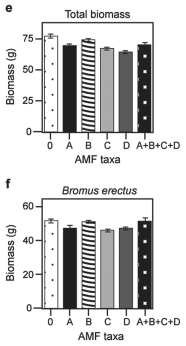
Figure 31.4 Figure 31.5
-Based on graphs (e) and (f) in Figure 31.5,which is the most well-supported prediction for the effect on total plant biomass if AMF diversity were increased to eight species?
Definitions:
Process
A series of actions or steps taken to achieve a particular end.
Theoretical Result
An outcome derived from abstract principles and reasoning, often without practical application or empirical testing.
Classical
Classical refers to the established theories and principles that have withstood the test of time, often foundational in fields like physics, music, and literature.
Probability
The likelihood that a particular event will happen, often expressed as a fraction or percentage reflecting the ratio of the occurrences of an event to the total number of possible outcomes.
Q5: Which of the following protist lineages is
Q6: Which of the following describe all existing
Q9: Which set contains the most closely related
Q14: After mutagenesis,the bacteria Sinorhizobium meliloti became unable
Q17: To create a viral vector for delivery
Q24: Apical meristems of dicots are at the
Q30: The HIV protease has been the target
Q31: The distribution of pocket-mouse coat colors in
Q37: The sperm and egg each contribute 50%
Q37: In the roundworm C.elegans,the lin-4 gene produces