Figure 4.2
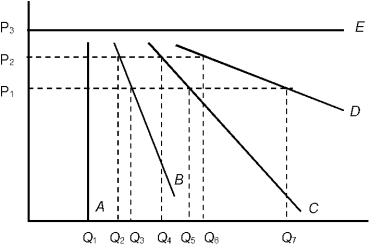
-In Figure 4.2, which demand curve is least likely to represent demand for high blood pressure medicine?
Definitions:
Nash Equilibrium
A situation in a non-cooperative game where each player's strategy is optimal given the strategies of the other players, and no unilateral deviation can be beneficial.
Cartel Output
The total level of production agreed upon by members of a cartel, who coordinate their pricing and output to maximize collective profits.
Jointly Maximize Profits
A strategy where firms coordinate their actions to increase their collective profits rather than competing with one another.
Agreement Breach
A failure to fulfill the terms of a contract or agreement, which can lead to legal action for resolution.
Q1: If the price of a product increases
Q2: Even in the United States, not all
Q13: A demand curve that is a vertical
Q67: If the price of tennis rackets increases
Q73: If a price ceiling results in the
Q84: Refer to Table 5.2. For what unit
Q85: Choices are not made because of limited<br>A)
Q140: When a cartel is successful,<br>A) it offers
Q154: According to the law of supply, if
Q159: If the demand curve for product J