Figure 7-3
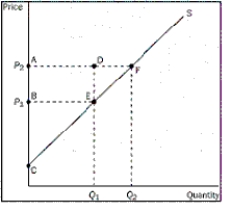
-Refer to Figure 7-3.Which area represents the increase in producer surplus when the price rises from P₁ to P₂ due to new producers entering the market
Definitions:
Control Limits
Statistical boundaries in a control chart that determine the acceptability range for a process variability, outside of which signals a process is out of control.
P Chart
A type of control chart used for monitoring the proportion of defective items in a process over time, helping in the identification of out-of-control processes.
Lower Control Limit
The threshold in quality control charts below which a process is considered out of control and indicating a potential problem.
Mean Sample Proportion
Indicates the average proportion of a characteristic within a sample, calculated as the sum of individual attributes divided by the sample size.
Q35: Donald produces nails at a cost of
Q39: If income tax rates in Sweden had
Q52: What is the effect of a tariff
Q120: The area above the demand curve and
Q121: Refer to Figure 9-10.What would be producer
Q133: Market demand is given as Q<sub>D </sub>=
Q144: Suppose Lauren,Leslie,and Lyndsay all purchase bulletin boards
Q156: The willingness to pay is the maximum
Q218: Using the graph shown below,answer the following
Q233: Suppose a tax is imposed on the